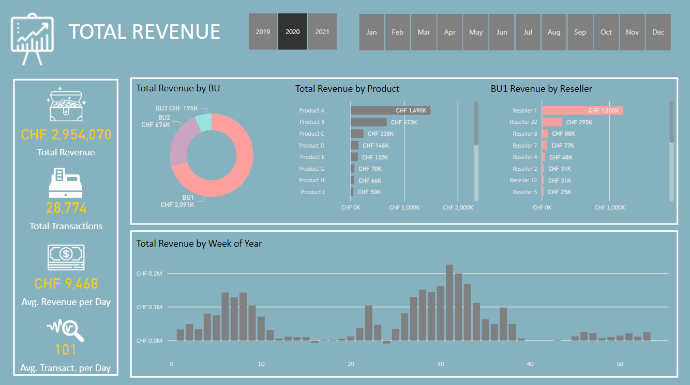
Sales Dashboard

The Challenge
This company used 3 different systems to book its sales transactions:
2. a new cash register,
3. an old cash register
The three systems were not connected between each other, hence it was very difficult to get an overview of the total sales. The company used to look at each different system and manually add the figures together to come up with the total sales figures. Since the process was time consuming, only the total aggregate figures were updated monthly adding limited insights to the operations.
The Solution
Using PowerBI we combined and transformed the export (XLS and XML files) from the three different systems so that all the records were standardized in one file. From that consolidated data model, we programmed all the measures and created an easy interactive dashboard to track sales performance on a daily, monthly, quarterly or yearly basis. The data also allowed us to slice and dice sales by different dimensions like resellers, product categories, payment methods, etc.
The Result
The company gained many timely insights on sales performance and could better understand the sales impact of different marketing activities and operational changes. Being able to easily update the sales figures, the company set up some key metrics to better track its performance.
Contact Us
If you need help on a similar topic or challenge, please contact us. We would be happy to schedule a call (free of charge) to learn more about your challenge and see how we can help you.